
Getting Started
Deployment- Automate Permalink Structure with Custom Deployment Script
- Steps to Minimise or Avoid Downtime When Taking a Website Live
- Create Site (WordPress environment)
- Integrating Git for whole site environment
- How to clone an existing site on Staq
- How to create a staging site
- How to sync a staging site to production
- How to take a website live (GoLive)
- Go Live with a subdomain
- Switch an existing Staq site to a brand new Staq site
- Customizing Deployment with CLI Commands
- Images broken in Slider Revolution after migration or CDN deployment
- Smart Slider images are broken after taking my website live
- Do you support Multi-Sites?
- Can I migrate a site to Staq using a third-party plugin?
- How to export a website from Staq to your own hosting environment
- Accessing the Old Website or Server Using the Hosts File
- How to migrate a site to Staq
- When a migration fails
- How to create a staging site
- How to sync a staging site to production
- Transitioning Changes from Staging to Live: A Guide to Synced Modifications
- Putting a Live Site back into Dev Mode
Site Management
Backups- Creating Backups
- Restoring a backup
- How to download your backup files
- Why Don’t I See Backups for a Particular Day?
- How our backup system works (comprehensive guide)
- Organizing Websites with Labels in Staq
- How to setup Client PDF Reports
- Managing Overage Costs and Alerts on Staq
- How to Bulk Reset Website Credentials
- Resetting Password Inside Staq Doesn’t Work
- How to Reset Your Password Inside Staq Panel
- One-Click WordPress Login Feature
- Enabling Popups for 1-Click WordPress Access in Supported Browsers
- Enable automatic plugin and theme updates with regression testing and auto rollback
- How to manually update Plugins/Themes faster using Staq Plugin Manager
- How to Deactivate or Delete a Plugin Across Multiple Sites
- Update Plugins/Themes: 1-Click to update everything
- Convert plugins into Global Plugins with a single click
- How to enable Maintenance Mode
- Installing a plugin on multiple websites at once
- How to install or update Plugins/Themes across all sites (globally)
- How to use Global Plugins to manage plugins at scale
- How to Fix “Briefly Unavailable for Scheduled Maintenance” Issue After Site Update
- Failed to Parse the Package Metadata: How to Fix
- How to diagnose when a Global Plugin isn’t updating across your sites
- Plugin/Theme Update Status via Email Notification
- Troubleshooting “Update Failed: Download Failed” Error
- Why some plugins may not automatically update
- My Plugins are not updating inside WordPress
- I cannot access the backend of WordPress
- The uploaded file exceeds the upload_max_filesize directive in php.ini
- Force deactivation of plugin/theme
- How to edit plugins/themes using a file manager editor
- How does regression testing work with Plugin/Theme updates?
- How to install plugin dependencies via Composer?
- Failed to Parse the Package Metadata: How to Fix
- How to setup Bitbucket with Staq (plugin/theme only)
- How to setup Github with Staq (plugin/theme only)
- How to replace “Staq Hosting” plugin inside WordPress with my brand
- Custom SMTP to send automated emails from Staq
Caching & Performance
Caching- Why Staq cache is the most optimal caching solution to use
- CLI commands for Staq cache
- Disable Staq Cache
- Enable/Disable Automatic Cache Clearing
- How to clear the cache for a selected number of pages regularly
- Disable Optimizer tool for certain pages
- How the Staq Cache Preload works
- How to cache a URL with a query string
- Staq Cache – Caching Dynamic Information
- Configure Staq Cache
- How to clear cache of all sites in Staq
- How to know when a page is cached and how to diagnose it if it isn’t
- Nonce and Cache TTL
- Fixing “Media Error: Format(s) Not Supported or Source(s) Not Found” on Videos
- Issues migrating to Staq because of LiteSpeed Cache
- My website design/layout is broken
- Cost Optimization Strategies
- Assessing Memory and PHP Worker Resources
- How to Optimize Autoloaded Options in WordPress for Better Performance
- Setup Speed Optimization
- Disable Optimizer tool for certain pages
- Enhancing Core Web Vitals: What web development processes to change
- Elementor: Maximise PageSpeed Insight scores with these settings
- How to Scale a WordPress Website with Staq
- How to Speed Up the Backend of WordPress & AJAX requests
- How to Increase PHP Workers
Security
Security- Enabling 2FA for WordPress Sites
- Staq’s Multi-Layer Security Architecture
- Content Security Policy Error: Causes and Solutions
- Enable Multi-Factor Authentication (MFA) on Staq
- How to Change the WP Login URL
- How to enable XML-RPC
- Staq enforces HSTS by default
- SendGrid IP Access Management
- Unblocking WordPress REST API Access
- My website uptime monitoring is showing the website is down but it’s up when I check?
- Why was an IP address blocked by Staq Firewall?
- How to ban an IP Address using Staq Firewall
- How Staq Firewall Blocks Bots Attacking Contact Forms
- How to block a country in the firewall
- Cloudflare 520 or 521 error
- How to stop DDoS attacks
- How to configure the Max Login Attempts (Firewall)
- How we block malicious comments submitted by bots
- Staq’s Multi-Layer Security Architecture
- Service Unavailable / 503 Error code and how to fix
- How to whitelist an IP address
- Staq is blocking my SEO tools with 502 or 503 server errors
- How the Staq Firewall system works
SMTP, CDN & DNS
SMTP- How to setup SMTP?
- Installing “WP Mail SMTP Pro”
- How to use Gmail as an SMTP service in WordPress
- Diagnosing SMTP / Email Connection, Receiving Emails
- Override Specific SMTP Global Settings
- SendGrid Integration
- Custom SMTP to send automated emails from Staq
- How to setup Staq Traditional CDN
- Enable Next-Gen CDN Instructions
- Increase CDN CloudFront invalidations daily limit
- Images do not show when I’m logged out
- Exclude Paths from Next-Gen CDN Cache
- Staq Next-Gen CDN vs Traditional CDN vs Cloudflare
- How to stop DDoS attacks
- How to use Cloudflare Proxy with a Staq hosted site
- Integrating Cloudflare with Staq
- How to enable Cloudflare CDN on Staq
- Staq Next-Gen CDN vs Traditional CDN vs Cloudflare
- How to disable Cloudflare
- Staq Next-Gen CDN: One or more CNAME already associated with resource
- CDN issue and how to diagnose and rectify
- ERR_SSL_VERSION_OR_CIPHER_MISMATCH with Cloudflare
- Traditional CDN Failed to Deploy Due to SSL Validation (CAA Error)
- CDN cache not clearing after changes to plugin/theme
- Is my site loading from AWS CloudFront?
- Switching DNS back to Staq and now the site doesn’t load
- IT company says they want to move DNS away from Staq. What should I say?
- Does Staq sell and manage domain names?
- DNS location and how to add a DNS entry
- Steps to Minimise or Avoid Downtime When Taking a Website Live
- How to Add NS Records for Subdomains on Staq
- DNS is not resolving
- Where you access the A record or NS Record
- How to add Google or Office365 MX records to Staq DNS
- Resolving Localized Issues Caused by Hardcoded IP Addresses in the Hosts File
- TXT record in DNS – CharacterStringTooLong
- How to move the DNS across to Staq when the site is already hosted on Staq
- How to enable instant DNS Propogation
Server & Tools
Analytics & Logs- How to track a site’s activity history
- Someone installed/deactivated a plugin. What logs are there?
- Server Logs
- Why Staq Shows More “Human Visitors” Than Google Analytics
- How to check if CRON jobs are working
- How to clear the cache for a selected number of pages regularly
- How to setup a Cron job in Staq
- Resolving the “Missed Schedule” Issue in WordPress
- Import a third-party SQL database over an existing website
- Running SQL queries inside Staq Panel
- How to use Staq Query Tool to diagnose database queries
- Access to phpMyAdmin / database
- SQL query to delete entire WooCommerce products in one hit
- Images broken in Slider Revolution after migration or CDN deployment
- How to do a Search & Replace
- How to download your backup files
- How to debug an issue
- My Website is Slow – How to Debug
- Troubleshooting Import Process Errors in WordPress
- How to Use Staq Debug for Troubleshooting Issues
- Integrating Git for whole site environment
- How to setup Bitbucket with Staq (plugin/theme only)
- How to setup Github with Staq (plugin/theme only)
- Increasing Server Memory
- How to Increase PHP Max Input Vars Limit
- Increase Max File Upload limit
- The server cannot process the image
- Increase Max Request Timeout
- Does Staq still support PHP 7.4?
- How to downgrade or upgrade to PHP version
- How to Increase PHP Workers
- Setup Domain Redirects
- Server Redirects
- SEO 301 Redirect
- How to Handle Regex Redirects with Query Parameters in WordPress
- How to Serve Static HTML Files Alongside Your WordPress Site
- Staq is blocking my SEO tools with 502 or 503 server errors
- Robots.txt file – managing the default file
- Server 500 error in browser. How to fix
- 403 Server Error
- Too Many Requests with Error Code 429
- How to fix Access-Control-Allow-Origin issue
- Cloudflare 520 or 521 error
- Troubleshooting Import Process Errors in WordPress
- 504 Gateway Time-out error
- Error 1000 on Cloudflare
- Fixing CORS Errors
- 502 Gateway error
- Fixing MIME-Type Errors Preventing Styles and Fonts from Loading
- Service Unavailable / 503 Error code and how to fix
- SSL Is Not Generating
- 403 Server Error
- How to add a custom SSL
- ERR_SSL_VERSION_OR_CIPHER_MISMATCH with Cloudflare
- Steps to Minimise or Avoid Downtime When Taking a Website Live
- Error 1000 on Cloudflare
- How SSL Certificates Work on Staq
- How to create a custom SSL certificate
Staq Billing
Staq Billing > Account- Invoice breakdown and viewing excess charges
- How to view invoices (Agency Invoice)
- How to update your credit card (Agency account holder only)
- How to view historical client invoices
- How to create a client and request for credit card details
- Assigning a Client to your agency custom plan
- Amending Your Client’s Details on File
- How to Determine the Reason for a Client’s Payment Failure
- How to add/update client’s credit card
- How to Resolve “A User with the Specified Email Already Exists” Error
- Adding a custom terms and conditions for your clients (digital agency POV)
- Changing currency when using Staq Billing to charge clients
- Customise automated emails to your clients
- Step-by-step instructions in setting up your automated billing to charge your clients hosting fees
Media
Media Media - Diagnose- Images broken in Slider Revolution after migration or CDN deployment
- Images do not show when I’m logged out
- Images or PDFs Showing a “404 Not Found” Error
- How to disable lazyload
Accounts & Billing
Accounts & Billing- Custom SMTP to send automated emails from Staq
- User Access to Staq Platform
- Cost Optimization Strategies
- Changing the timezone throughout the Staq dashboard
- How to see when dev sites will incur charges
- How to unsubscribe or delete or cancel a site in Staq
- Client Transfer
- Does Staq offer annual billing?
- Pricing: How Does Staq Charge?
- Enable Multi-Factor Authentication (MFA) on Staq
- Renaming Your Website in Staq
- Canceling an existing site subscription and assigning it to a new user
- Enabling Popups for 1-Click WordPress Access in Supported Browsers
- Putting a Live Site back into Dev Mode
General
WordPress Hosting- Do we offer email hosting?
- Is Sage/Roots compatible with Staq?
- Do You Provide Web Hosting to Any Platform or Just WordPress?
- Do You Provide SSH Access?
- Can I run 2 separate WP installs on the same domain?
- How to enable XML-RPC
- Hosted elsewhere (Site no longer hosted on Staq) Message
- Robots.txt file – managing the default file
- Staq Infrastructure Overview
- How to edit the wp-config.php file on Staq
- Do you support Multi-Sites?
- My website design/layout is broken
- Website is down
- How to use Staq Query Tool to diagnose database queries
- How to use Query Monitor plugin
How to debug an issue
Encountering a WordPress error like “There has been a critical error on this website”, a 500 server error, or a website not loading can be frustrating. These errors are often isolated to the WordPress site itself and usually result from a PHP error in a plugin or theme, not the hosting account. This guide will help you diagnose and resolve such issues effectively.
Understanding Common Errors
- 503 Server Error: If you receive a 503 error, refer to our 503 Error Guide.
- 500 Server Error: This typically indicates a lack of memory issue. See our 500 Error Guide.
- Critical Error: This relates to a PHP error in a plugin or theme.
How to Enable Staq Debug Tool
The Staq Debug Tool is your first step in diagnosing WordPress issues. Follow these steps:
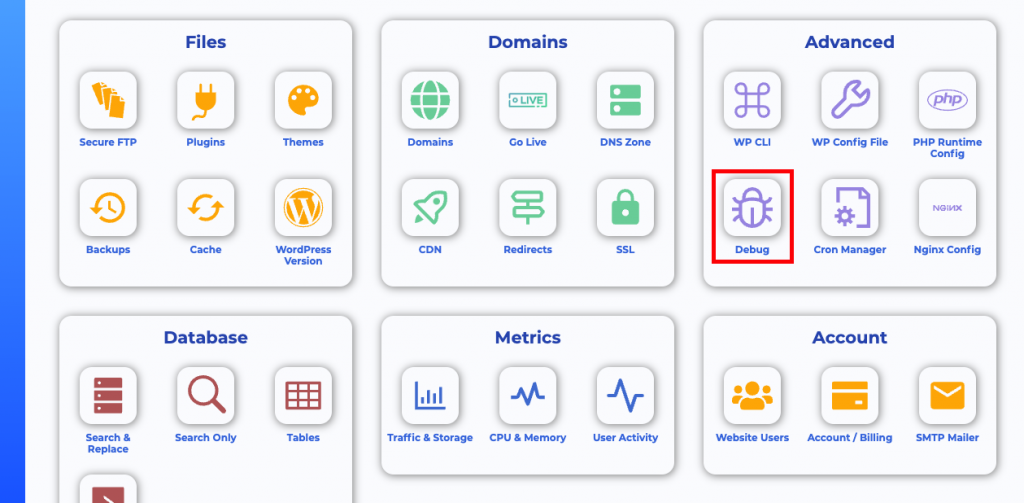
- Log in to the Staq Panel of the affected website.
- Go to Advanced and click Debug:
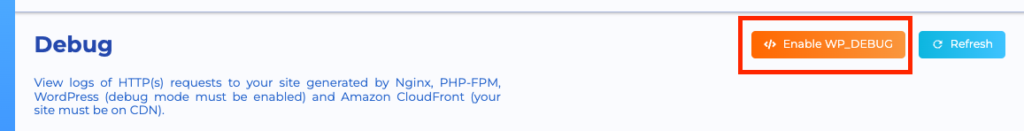
- Click Enable Debug in the top-right corner:
- Go to the page showing the critical error and refresh the page to generate a log.
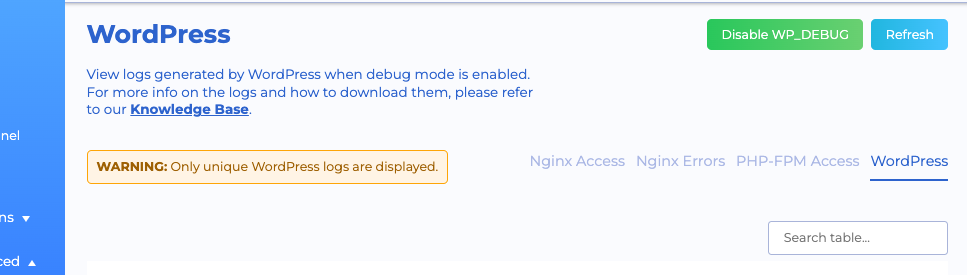
- Navigate to the WordPress tab and click Refresh to display any errors:
Diagnosing Errors
If there is an error, it should show in the Severity column. Then beside the error, you can click Debug with AI:
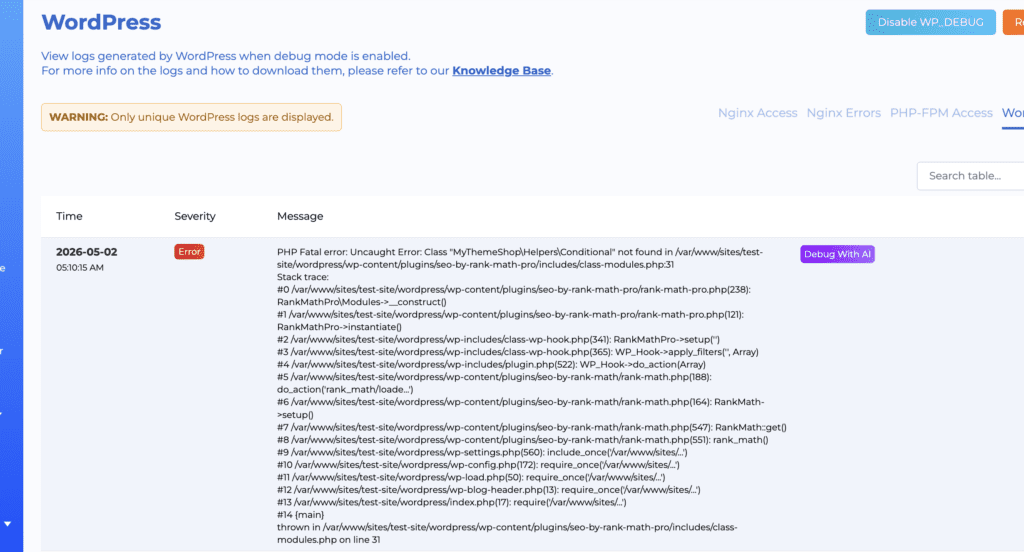
Our custom AI tool will debug the issue and will assist you on understanding the error. Where it can, it’ll provide suggestions like identifying where the error is if it’s inside your theme file or plugin. Sometimes updating a theme/plugin can rectify the issue. An example of how it can assist you appears below:
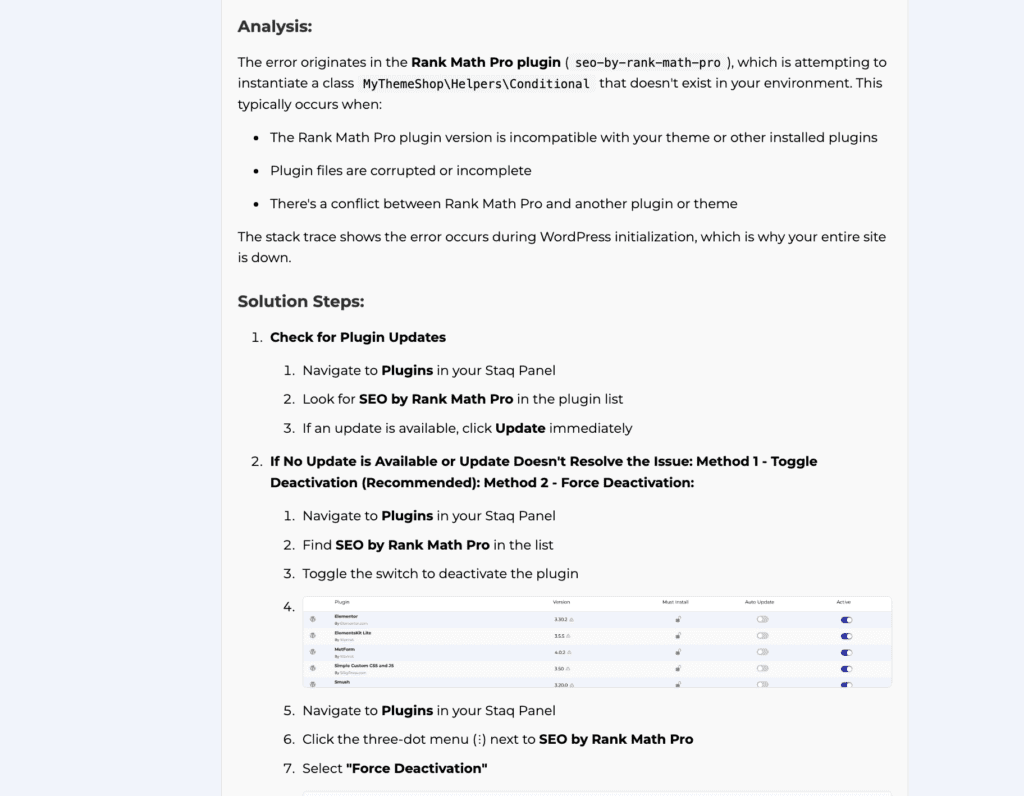
Resolving Plugin Issues
- Update the plugin to the latest version.
- Ensure related plugins (e.g., Elementor or WooCommerce add-ons) are also updated.
- If this fails, disable the plugin
- if this isn’t an option, perhaps you need to downgrade PHP version to our lowest version which is 7.4 if it’s on PHP version 8.x
Resolving Theme Issues
- Update the theme to the latest version.
- Fix any errors in the child theme or theme files based on the debug log.
- If this fails, perhaps you need to downgrade PHP version to our lowest version which is 7.4 if it’s on PHP version 8.x.
Critical Error Message
If you see the message “There has been a critical error on this website,” it indicates a PHP error in a plugin or theme. Use the steps above on how to enable the Staq Debug tool to diagnose the issue.
Please note to generate the error message inside the logs, do the following:
- go to the page that shows “There has been a critical error on this website” and refresh the page
- Go back to the Debug screen inside the Staq interface and under the WordPress tab, click Refresh to reveal the issue.
- Read the output of the error. If you do not understand it, copy/paste the error log into ChatGPT and ask it to explain it in plain English.
The the error shows the Staq MU-Plugin
If the Debug tool reveals that it’s the Staq mu-plugin is the cause, please open a ticket with our support team to investigate.
How to Disable the Staq Debug Tool
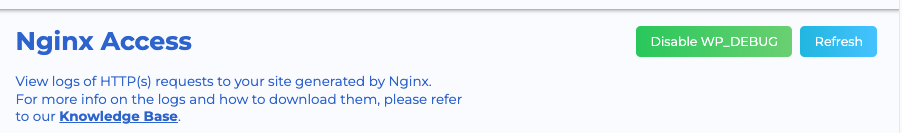
It is important that once you’ve finished diagnosing the issue to disable the WP debug and logging tool. To do so, go back to Staq Panel > Debug and click Disable WP_DEBUG:
Slow Website – Query Tools
Query Slow Database
If you need to perform a query and database execution diagnostic, please check out this guide on how to perform a query and database query diagnostic.
Query Slow Plugins/Themes
If you wish to perform a diagnostic to see which plugin/theme is causing a slow website, please check out this guide on how to use Query Monitor plugin.
Troubleshooting Additional Issues
What If the Debug Log Shows No Errors?
- Disable all plugins, then enable them one by one to identify the problematic plugin.
PHP Compatibility
If the issue persists, verify that all plugins and themes are compatible with the PHP version running on your server. Follow this guide: PHP 8 Compatibility Testing. Please note that this is a guide only. You may need to downgrade to PHP7.4 to verify if the problem persists.
Accessing the Backend
If you cannot access the backend, follow this guide: Reclaim Access to WordPress Backend.
Other Server Errors
See these guides for other server errors:
Need some help?
We all do sometimes. Please reach out to our support team by dropping us a support ticket. We will respond fast.
